WELCOME TO MY GIS JOURNEY!
With six weeks of GIScience experience under my belt, I've been exposed to several concepts, mostly pertaining to the frameworks of mapping and spatial data models. However, this assignment was the first time I applied my own spatial analyses to a scenario and extracted information using ArcGIS's program - ArcMap.
CLIMATE CHANGE & STORM SURGES
Today, climate change is the biggest threat to humanity. As a climate activist and Environment & Sustainability student, I think about the effects of climate change everyday. One of the risks that climate change poses is the increased possibility of storm surges in my beloved city, Vancouver. As a result, I made four maps to showcase the low-lying and flood-prone areas, as well as major routes that would be jeopardized in the case of a storm surge in Metro Vancouver.
But wait, what is a storm surge?
Storm surges are the rising of the sea as a result of atmospheric pressure changes and wind associated with a storm. They can be extremely destructive, not only causing damage to infrastructure and properties, but also to the lives of many. In mitigation of these impacts, GIS helps to forecast, manage, and respond to these by giving valuable insights from spatial information.
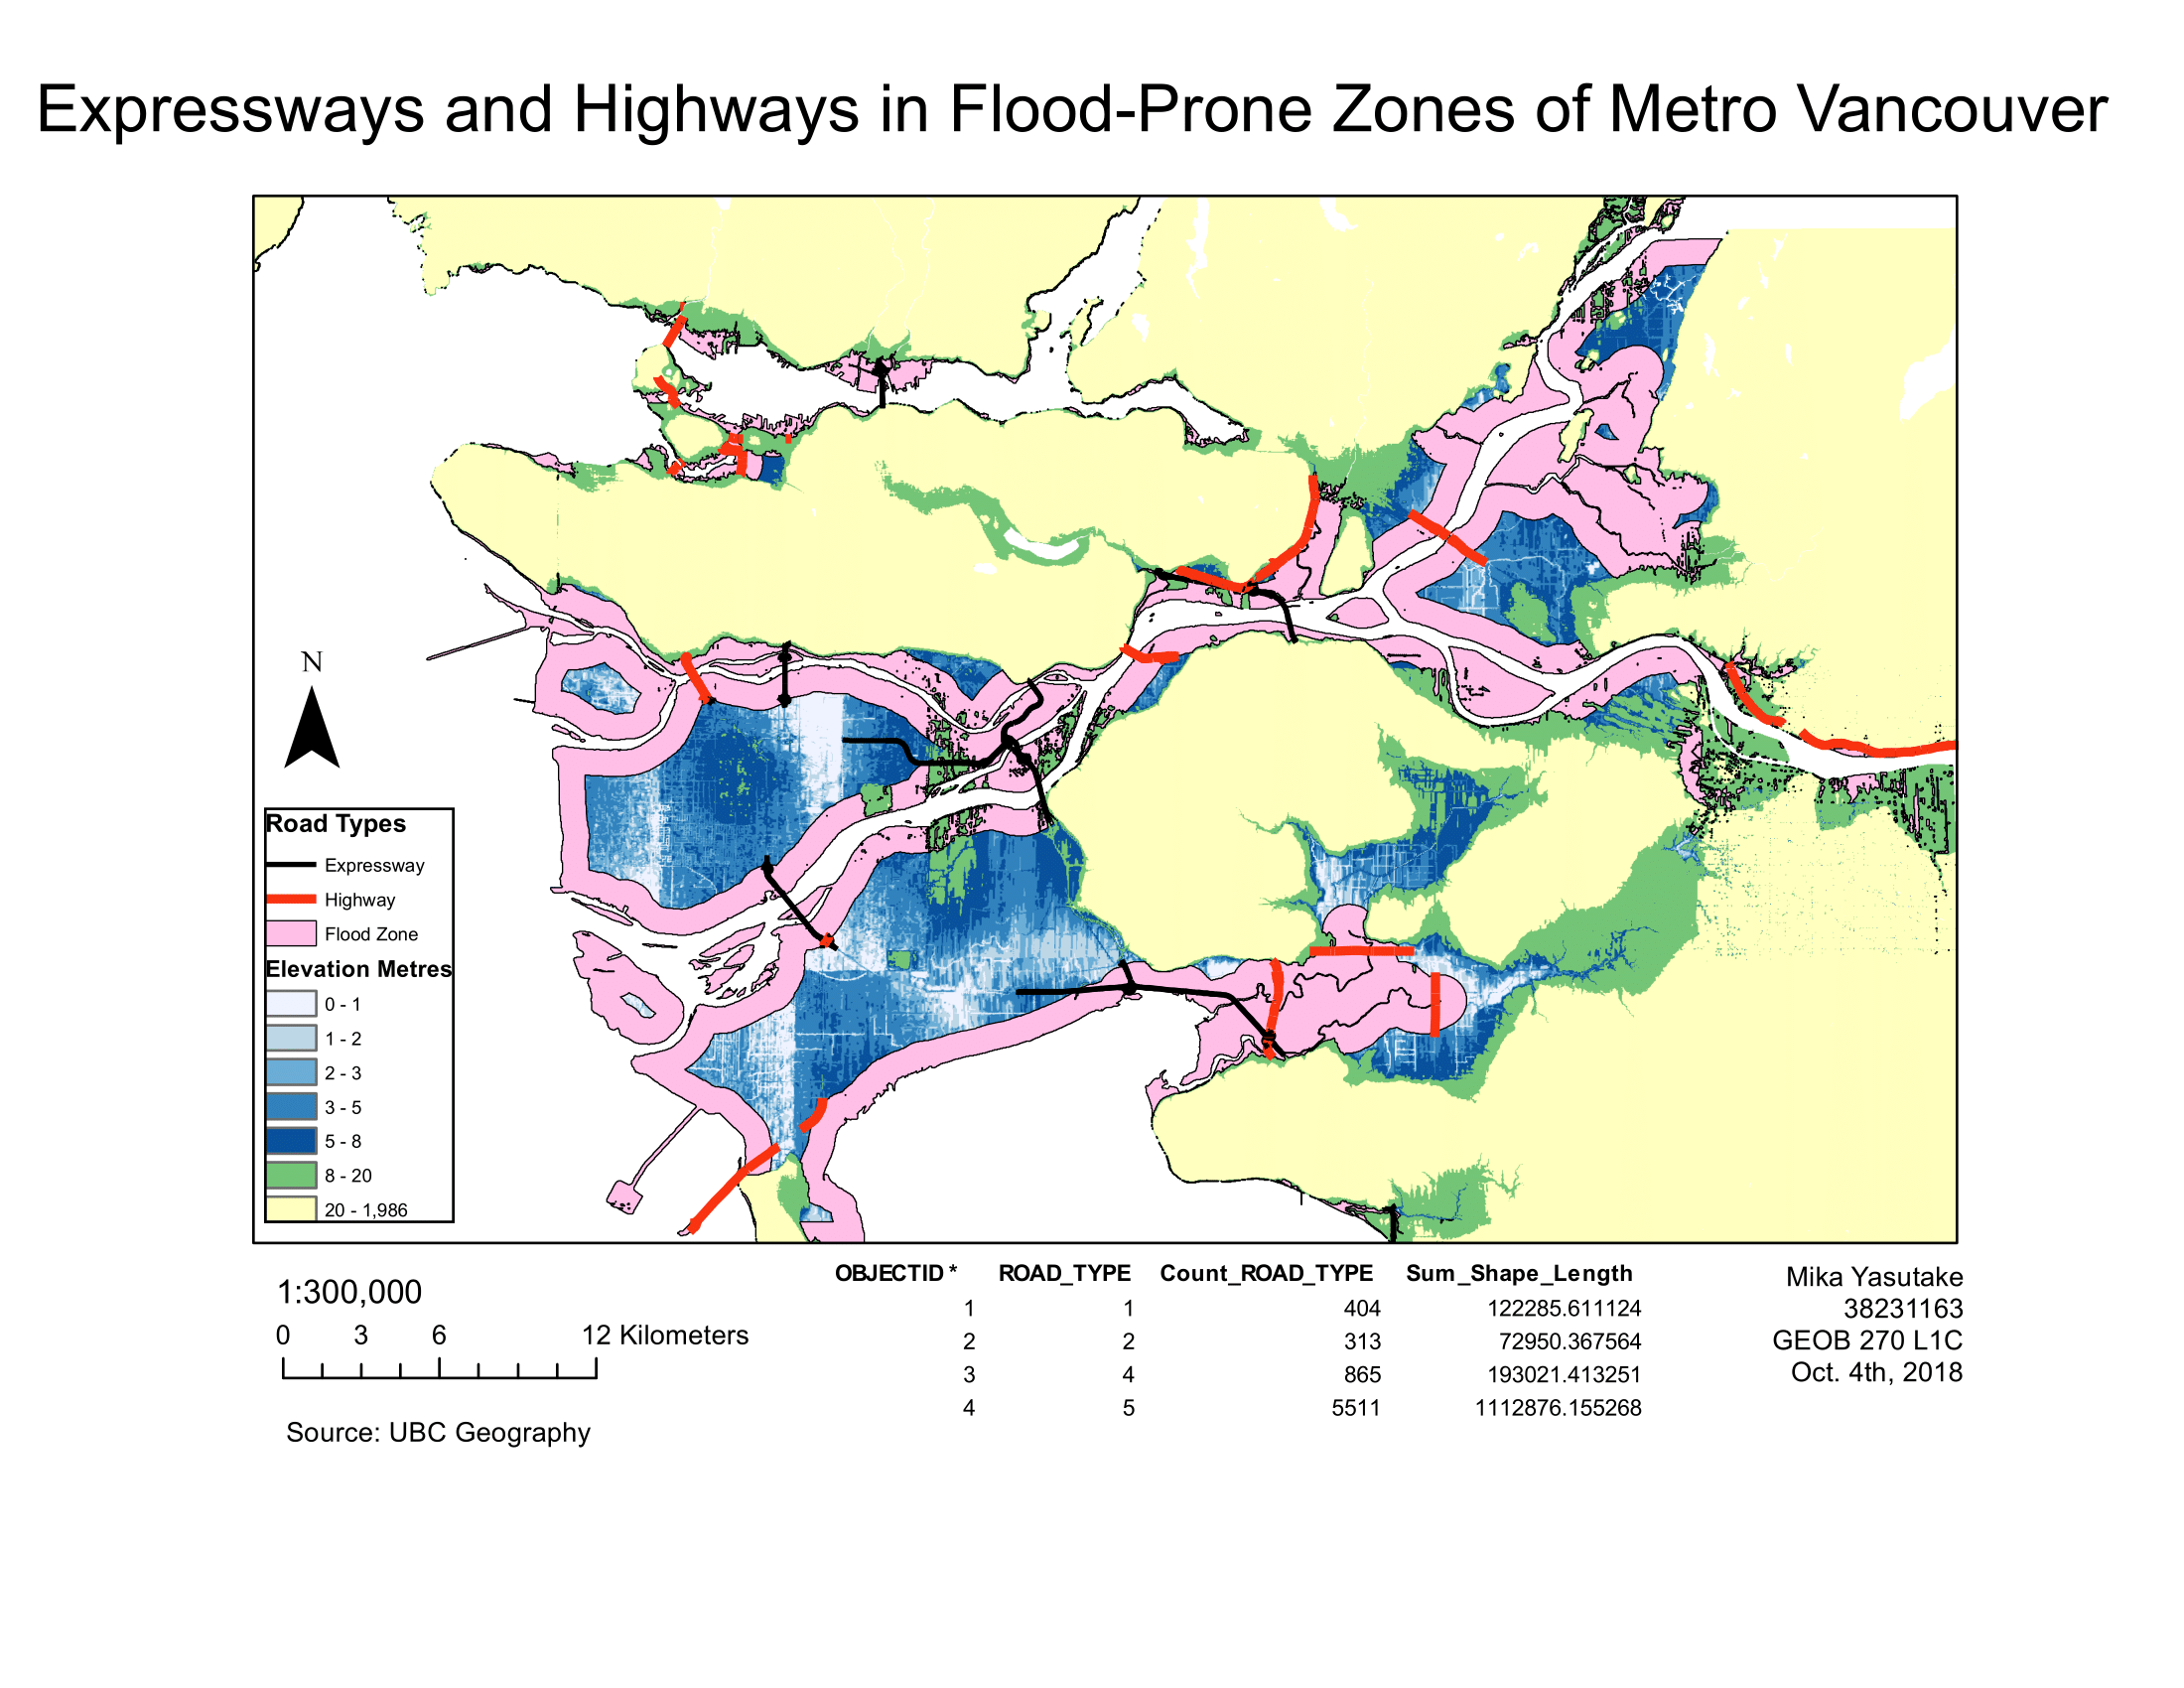
The above map highlights areas of Vancouver that are lower than 20m in elevation, while displaying flood-prone zones and major vehicle routes that intersect them.
Some Skills I picked Up Along the Way are:
- Acquired Census and Statistical data from open data sources to conduct spatial analyses
- Prepared a geodatabase to avoid losing data and for spatial analyses
- Reclassified raster DEM into vector to show low elevation areas
- Performed buffer proximity analysis of coastal areas to identify flood-prone zones
- Intersected low-lying areas with flood-prone zones to feature potential flooding areas
- Created summary table of roads that fall within potential flood zones to highlight high-risk transit corridors
- Created map of results for visual data representation
Findings from My Spatial Analyses:
In Metro Vancouver, 547 km2 was found to lie below 8m in elevation while just under 200 km of highways and expressways may be affected by potential storm surges. This carries serious implications on decision-making and natural hazard mitigation, encouraging city planners and developers to increasingly take climate change into consideration. Furthermore, based on my map, Southern and Eastern suburbs of Metro Vancouver are at greater risks to storm surges and flooding. However, within the City of Vancouver itself, the neighbourhoods of False Creek, Downtown Vancouver, Strathcona, Kitsilano, Lonsdale Quay, and parts of Stanley Park can also be seen to be at risk. These are areas of high density and therefore, gives rise to the concept of "climate migrants" within our own backyard.
This assignment has emphasized the importance of spatial data and the power that geospatial analyses have in giving insights and influencing policy and decision makers. It has also encouraged me to begin thinking about principles and conventions of visual data representation as both a map-user and map-maker.